If you’ve checked Google Search Console lately and seen angry red warnings about your Core Web Vitals, you’re not alone. Thousands of website owners are watching their rankings slip because their sites fail Google’s performance tests. The frustrating part? Most don’t know where to start fixing the problems.
This guide walks you through exactly how to diagnose and fix Core Web Vitals issues, with practical steps you can implement today—whether you’re running WordPress, Shopify, or a custom site.
What Are Core Web Vitals Optimization (And Why Google Cares)
Core Web Vitals are three specific metrics Google uses to measure user experience on your website:
Largest Contentful Paint (LCP) measures loading performance. It tracks how long it takes for the largest visible element on your page to appear. Google wants this under 2.5 seconds.
Interaction to Next Paint (INP) replaced First Input Delay in 2024 and measures responsiveness. It evaluates how quickly your page responds when users click, tap, or interact with it. The target is under 200 milliseconds.
Cumulative Layout Shift (CLS) measures visual stability. It tracks the unexpected movement of page elements as the page loads. Google wants a score below 0.1.
Why Core Web Vitals Optimization Matters for SEO in 2026
Core Web Vitals became a ranking factor in 2021, but their importance has only grown. Google’s algorithm now weighs user experience more heavily than ever, and sites with poor Core Web Vitals scores face tangible ranking penalties.
According to recent studies, websites that pass all Core Web Vitals thresholds see up to 24% higher organic visibility compared to failing sites. More importantly, pages with good LCP scores have 70% lower bounce rates, directly impacting your conversion rates and revenue.
One e-commerce site documented a real-world example: after improving their LCP from 4.2 seconds to 1.8 seconds and fixing CLS issues, they saw a 15% increase in organic traffic and a 12% boost in conversions within three months. The connection between performance and business results is no longer theoretical.
Understanding Each Metric in Detail
LCP (Largest Contentful Paint): What It Measures
LCP measures when the largest content element becomes visible in the viewport. This is usually your hero image, a large text block, or a video thumbnail. The metric captures perceived loading speed—how fast your page feels to users.
Common issues causing poor LCP include oversized images without optimization, slow server response times, render-blocking CSS and JavaScript, and missing resource prioritization. Many WordPress sites struggle with LCP because themes load large header images without proper optimization.
INP (Interaction to Next Paint): Interactivity Problems
INP evaluates the delay between a user action and the visual response. Every time someone clicks a button, opens a menu, or fills out a form, INP measures how long before they see a result.

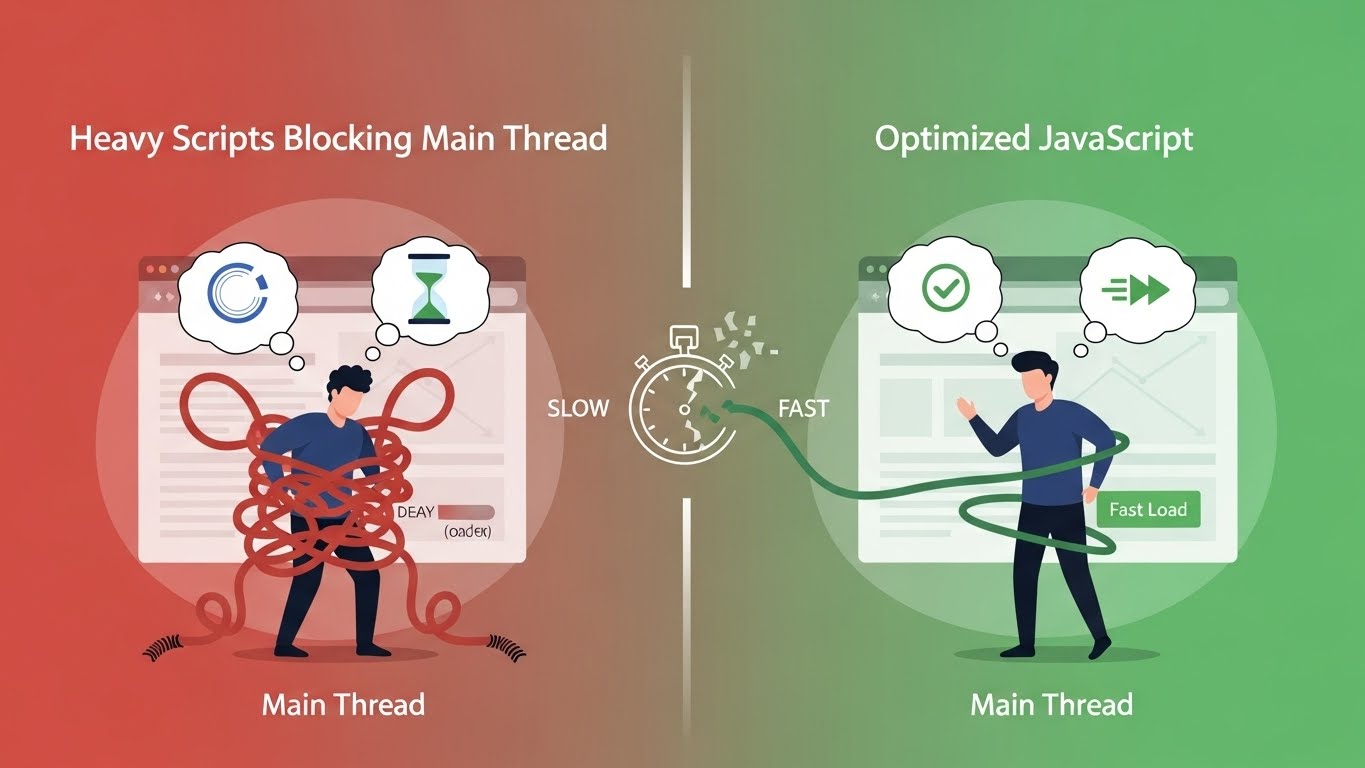
The biggest culprits behind poor INP scores are heavy JavaScript execution blocking the main thread, long-running scripts that prevent the browser from responding to input, poorly optimized third-party scripts like chat widgets or analytics, and frameworks that execute too much code before pages become interactive.
CLS (Cumulative Layout Shift): Layout Stability Issues
CLS quantifies how much visible content shifts unexpectedly as a page loads. If you’ve ever tried to click a link only to have it move at the last second, you’ve experienced poor CLS.
This happens when images load without defined dimensions, ads or embeds insert themselves and push content down, web fonts swap in and cause text reflow, or dynamic content appears above existing elements. These shifts frustrate users and often lead to accidental clicks on the wrong elements.
How to Test Your Core Web Vitals
Google PageSpeed Insights Walkthrough
PageSpeed Insights is your primary diagnostic tool. Visit the tool, enter your URL, and wait for the analysis. The report shows two sets of data: field data from real users over the past 28 days, and lab data from a simulated test environment. Step-by-step guide for WordPress speed optimization,
Focus on the field data first—this reflects actual user experience. If field data isn’t available for your site, rely on lab data but understand it represents only one testing scenario. The colored badges (green, orange, red) immediately show which metrics pass or fail Google’s thresholds.
Below the scores, you’ll find specific opportunities and diagnostics explaining what’s slowing your site. Each recommendation includes the estimated time savings, helping you prioritize fixes that deliver the biggest impact.

Search Console Core Web Vitals Report
Your Search Console account contains a dedicated Core Web Vitals report showing which pages pass or fail, grouped by similar issues. This report uses real user data collected from Chrome browsers, making it more reliable than lab testing.
Check both mobile and desktop reports, as they often show different issues. Mobile typically has stricter requirements and worse performance due to slower network speeds and less powerful processors. Click on any issue group to see which specific URLs are affected.
Real User Monitoring vs Lab Data
Lab data from PageSpeed Insights provides controlled, reproducible results perfect for debugging specific issues. However, it tests only one device configuration and network speed, missing the variability of real-world conditions.
Real user monitoring (RUM) from Search Console or third-party tools captures actual user experiences across different devices, locations, and connection speeds. Use lab data to identify and fix problems, then verify improvements using RUM data over time.
Fixing LCP Issues: Make Your Content Load Faster
Optimize Hero Images
Your hero image is usually the LCP element, so optimizing it delivers immediate results. Convert images to modern formats like WebP or AVIF, which offer better compression than JPEG. Aim for hero images under 200KB without visible quality loss.

Use responsive images with the srcset attribute to serve appropriately sized images for different screen sizes. A mobile user doesn’t need your 4000px wide desktop hero image. Implement lazy loading for below-the-fold images, but never lazy load your LCP element—this delays its loading and worsens your score.
Implement Preloading
Preloading tells the browser to prioritize critical resources before it would naturally discover them. Add a preload link for your LCP image in the HTML head section to start downloading it immediately as the page loads.
For example: <link rel=”preload” as=”image” href=”/hero-image.webp”>. This ensures the browser begins fetching the image before parsing CSS or JavaScript that might normally delay it.
Remove Render-Blocking Resources
CSS and JavaScript files block rendering until they download and execute. Identify render-blocking resources in PageSpeed Insights, then inline critical CSS directly in your HTML for above-the-fold content. This eliminates the network request delay for essential styles.
For non-critical CSS, use media queries to defer loading or load it asynchronously. With JavaScript, add defer or async attributes to script tags, pushing non-essential scripts to load after the main content renders.
Server Response Time (TTFB) Improvements
Time to First Byte measures how quickly your server responds to requests. Slow TTFB directly impacts LCP since content can’t load until the server responds. Implement caching at multiple levels—browser caching, CDN caching, and server-side caching through Redis or Memcached.
Upgrade to faster hosting if you’re on budget shared hosting. A quality managed WordPress host or VPS with proper optimization can reduce TTFB from 800ms to under 200ms. Use a CDN to serve static assets from locations closer to your users, reducing network latency.
Fixing INP Issues: Make Your Site More Responsive
Reduce JavaScript Execution Time
Heavy JavaScript is the primary cause of poor INP scores. Open Chrome DevTools, run a performance profile, and identify scripts consuming the most execution time. You’ll often find third-party widgets, analytics scripts, or poorly optimized theme JavaScript causing bottlenecks.
Remove unused JavaScript entirely rather than just deferring it. Many sites load entire libraries when they only use a few functions. Consider replacing heavy frameworks with lighter alternatives or vanilla JavaScript for simple interactions.
Break Up Long Tasks
JavaScript tasks over 50ms block the main thread and prevent the browser from responding to user input. Identify long tasks in your performance profile, then break them into smaller chunks using techniques like code splitting.
For WordPress users, many page builders and plugins generate monolithic JavaScript bundles. Switch to more performance-focused alternatives or manually optimize by removing unused features from plugins.
Use Web Workers
Web workers run JavaScript in background threads, preventing heavy computations from blocking user interactions. Move intensive operations like data processing, complex calculations, or API response parsing to web workers.
This technique works particularly well for interactive features like search autocomplete, form validation, or real-time data updates. The main thread stays responsive while background threads handle the heavy lifting.
Defer Non-Critical Scripts
Add the defer attribute to script tags for JavaScript that doesn’t need to run immediately. Deferred scripts download in parallel with page parsing but only execute after the HTML is fully parsed, preventing them from blocking rendering.
For third-party scripts like social media widgets, chat tools, or advertising scripts, implement lazy loading that only loads these resources when users scroll near them or interact with trigger elements.
Fixing CLS Issues: Stop Your Page from Jumping Around
Set Image and Video Dimensions
Always specify width and height attributes on images and videos in your HTML. Modern browsers use these dimensions to reserve the correct space before the media loads, preventing layout shifts.
Even if you’re using CSS to make images responsive, include the aspect ratio through dimensions or CSS aspect-ratio property. For example: <img src=”photo.jpg” width=”800″ height=”600″ alt=”Description”>. The browser calculates the aspect ratio and maintains proper spacing during loading.
Avoid Inserting Content Above Existing Content
Never inject content above the fold after page load unless it’s in response to a user interaction. This includes dynamically loaded banners, cookie notices, or notification bars that push content down.
If you must add elements, reserve space for them in the initial layout or insert them at the bottom of the viewport where they won’t shift visible content. For cookie banners, use CSS to overlay them on existing content rather than pushing content down.
Optimize Web Fonts Loading
Custom web fonts cause CLS when they swap in and replace fallback fonts with different dimensions. Use the font-display: swap property to show fallback fonts immediately while custom fonts load, but pair this with properly matched fallback fonts to minimize size differences.
Better yet, use font-display: optional which only shows the custom font if it loads within the first 100ms. Preload critical fonts using <link rel=”preload” as=”font”> to increase the chances of fonts loading before first render.
Consider subsetting fonts to include only the characters you actually use, dramatically reducing file sizes and load times. Tools like glyphhanger identify which characters your site uses, letting you create custom font subsets.

Reserve Space for Ads
Advertising slots are notorious CLS offenders. Use CSS to define minimum heights for ad containers matching your ad dimensions. Even if an ad doesn’t fill immediately, the space remains reserved.
For responsive ads with variable heights, set a minimum height based on the smallest expected ad size. This doesn’t eliminate all shifting but minimizes it significantly. Work with ad networks that support fixed-size ad slots rather than fluid layouts when possible.
Advanced Techniques for Optimal Performance
Critical CSS Implementation
Critical CSS is the minimal CSS needed to render above-the-fold content. Extract this CSS and inline it directly in your HTML head while deferring the full stylesheet. This prevents render-blocking and displays content faster.
Tools like Critical or Penthouse automate critical CSS extraction. For WordPress users, plugins like WP Rocket or Asset CleanUp include built-in critical CSS generation. Test thoroughly after implementing, as incorrect critical CSS can cause styling issues.
Resource Hints (Preload, Prefetch, Preconnect)
Resource hints tell browsers which resources to prioritize or prepare for. Use preconnect for critical third-party domains to establish early connections, reducing DNS lookup and connection time when resources are needed.
Use dns-prefetch for resources that might be needed, performing only the DNS lookup without full connection establishment. Use prefetch for resources needed on the next page, downloading them during idle time on the current page.
Example: <link rel=”preconnect” href=”https://fonts.googleapis.com”> establishes a connection to Google Fonts before font files are requested, saving hundreds of milliseconds.
Font Optimization Strategies
Beyond font-display strategies, consider using variable fonts that combine multiple weights and styles into a single file. This reduces the number of font files to download while providing full typographic flexibility.
Host fonts locally rather than loading from Google Fonts or other external services. This gives you complete control over caching, preloading, and eliminates the third-party connection overhead. Modern browsers support WOFF2 format, which offers excellent compression.
For body text, stick to system fonts that don’t require downloads at all. Fonts like -apple-system, BlinkMacSystemFont, Segoe UI, and Roboto provide excellent readability without performance costs.
Monitoring and Maintaining Good Scores
Tools for Ongoing Monitoring
Don’t rely solely on manual testing. Set up continuous monitoring using tools like Google’s web-vitals JavaScript library to collect real user metrics, or services like Cloudflare Web Analytics, SpeedCurve, or Calibre that track Core Web Vitals over time.
These tools alert you when scores degrade, often catching problems caused by plugin updates, theme changes, or new content before they impact rankings. Weekly automated tests from multiple locations provide baseline performance data you can compare against.
Monthly Audit Checklist
Establish a monthly performance audit routine to catch issues early. Check Search Console Core Web Vitals report for new failing URLs, run PageSpeed Insights tests on key landing pages, review recently published content for optimization opportunities, and verify third-party scripts haven’t added bloat.
Test after major WordPress or plugin updates, as updates often introduce performance regressions. Keep detailed records of your scores to identify trends—gradual degradation often indicates accumulating technical debt that needs addressing.
Audit your image optimization regularly. New content creators might upload unoptimized images, or automated optimization might fail. Check that caching is working properly and CDN coverage extends to all static assets.
Take Action on Your Core Web Vitals optimization Today
Improving Core Web Vitals isn’t optional anymore—it’s essential for maintaining and growing your organic traffic. The good news is that most issues have straightforward solutions once you understand what’s causing poor scores.
Start with the quick wins: optimize your images, implement preloading for critical resources, and set proper dimensions on media elements. These changes alone often improve scores from failing to passing thresholds.

For more complex issues involving JavaScript optimization, critical CSS implementation, or server performance tuning, consider professional help. WpSpeedFixer specializes in WordPress Core Web Vitals optimization, providing comprehensive audits and hands-on fixes that pass Google’s tests.
Ready to fix your Core Web Vitals and recover lost rankings? Contact WpSpeedFixer for a free performance audit and discover exactly what’s holding your site back. Our team implements proven optimization strategies that deliver measurable results—better scores, higher rankings, and increased conversions.